Why most car dealers are flying blind, and what the data really shows
Every vehicle sale, test drive, finance arrangement, and stock movement generates data. Yet most dealerships, from single-site independents to large franchise groups, are not using that data to make decisions. Instead, they are relying on instinct, experience, and spreadsheets.
For independent dealers, the problem is a lack of accessible tools. The enterprise analytics tools available have historically been priced and built for scale that these businesses do not have.
For larger franchise groups, the challenge is fundamentally different. It is not about which DMS you use, it’s about the ecosystem that surrounds it. New car sales, used vehicles, finance and insurance, after-sales, service booking, warranty management, customer communications, value-added products: each function typically runs on its own platform, its own data model, and its own reporting logic.
Of course, the data exists. But it lives in silos. There is no connected view, and no layer capable of turning that fragmented landscape into actionable insight across the whole business.
In a market defined by tightening margins and growing online competition, this disconnect is becoming an increasingly costly habit.
The numbers: Independent dealers
~30% of used car inventory sits unsold beyond 60 days1
–18% compression in average gross profit per used vehicle over the last three years2
40%+ of overhead cost at independent sites is untracked at departmental level3
£8,000–£12,000 estimated annual margin leakage per site from late repricing of aged stock alone4
For an independent car dealer, these are not abstract figures. A 14-day improvement in average days-in-stock across a 150-unit lot frees critical working capital. Making these changes results in a compound positive effective over a financial year.
1. Cox Automotive, 2023
2. NADA Dealership Financial Profile, 2023
3. IMI / SMMT industry estimates
4. Auto Trader Retail Radar, UK 2023
The numbers: Franchise groups
7–12 separate platforms the average franchise group uses across the full customer and vehicle lifecycle1
67% of dealer group heads report inability to get a real-time consolidated view across their network2
3–5 days average lag between operational events and management reporting at group level3
£250K+ estimated annual cost of poor stock allocation decisions across a 10-site group4
The consequence at group level is that strategic decisions around stock rebalancing, pricing policy, headcount, and capital allocation are being made on lagged, incomplete, and unconnected data. That is not simply a reporting problem. It is a competitive disadvantage that’s hurting the business now.
1. Keyloop Industry Report, 2023
2. Auto Trader Retail Radar, UK 2023
3. KPMG Automotive Retail Survey, 2023
4. Cox Automotive / Manheim, 2023
The commercial problem: You’re missing connected insights
A modern franchise group may run a single DMS across all sites. But layered around it are separate platforms for a range of functions: new vehicle order management, used car appraisal, consumer finance, GAP and warranty products, service lane scheduling, MOT reminders, customer satisfaction tracking, and more.
Each system does its job. But none of them talk to each other in a way that produces intelligence. The result is a business generating enormous operational data, with almost no ability to draw connected conclusions from it.
For independent car dealerships, the gap is simpler but equally damaging: without the right tools, even the data you do have, such as stock, sales and overheads, remains locked inside whatever systems you’re using: unanalysed and underused.
How QEA AutoLens helps
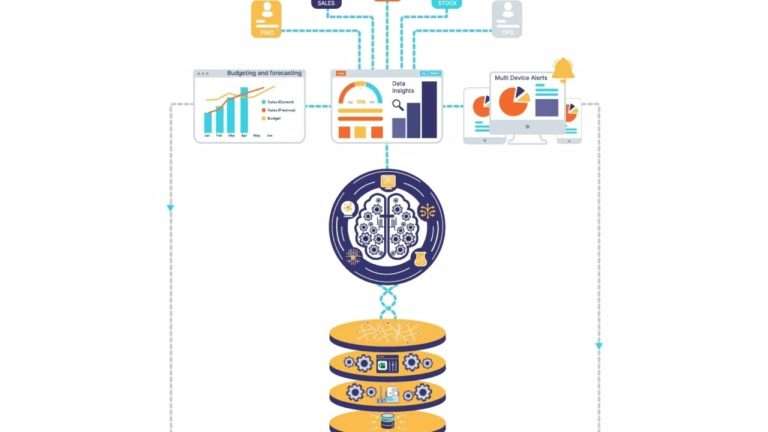
QEA AutoLens is the dealer intelligence platform built by Insight Delivered to sit above your existing technology stack and turn fragmented operational data into connected, actionable insight. It can do this without the need to replace any of your current systems.
For independent dealers, it delivers enterprise-grade analytics without the price tag or the need for anyone extra on your team. For franchise groups, it acts as the intelligence layer across the full ecosystem, producing a single, live view of performance that no individual system can provide on its own.
The platform covers:
- Sales analytics: Pipeline, revenue, conversion, finance penetration.
- Stock insights: Age profiles, turn velocity, margin per unit.
- Overhead intelligence: Departmental cost tracking, anomaly detection.
- Market insights: Live benchmarking and pricing intelligence.
- Accountant pack PRO: VAT reporting, bank reconciliation, financial summaries
The cost of inaction
The dealers who will thrive in the next five years are those who close the intelligence gap now, before it becomes a competitive disadvantage too wide to recover from.
The infrastructure to close that gap exists today. It does not require a transformation project. It requires the right platform, connected to the right data. It’s QEA AUtoLens.
See it in action
We are running live demos of QEA AutoLens throughout March and April 2026, including walkthroughs using data from comparable dealer profiles.